Campaign Zero Police Contract & Use of Force Reports
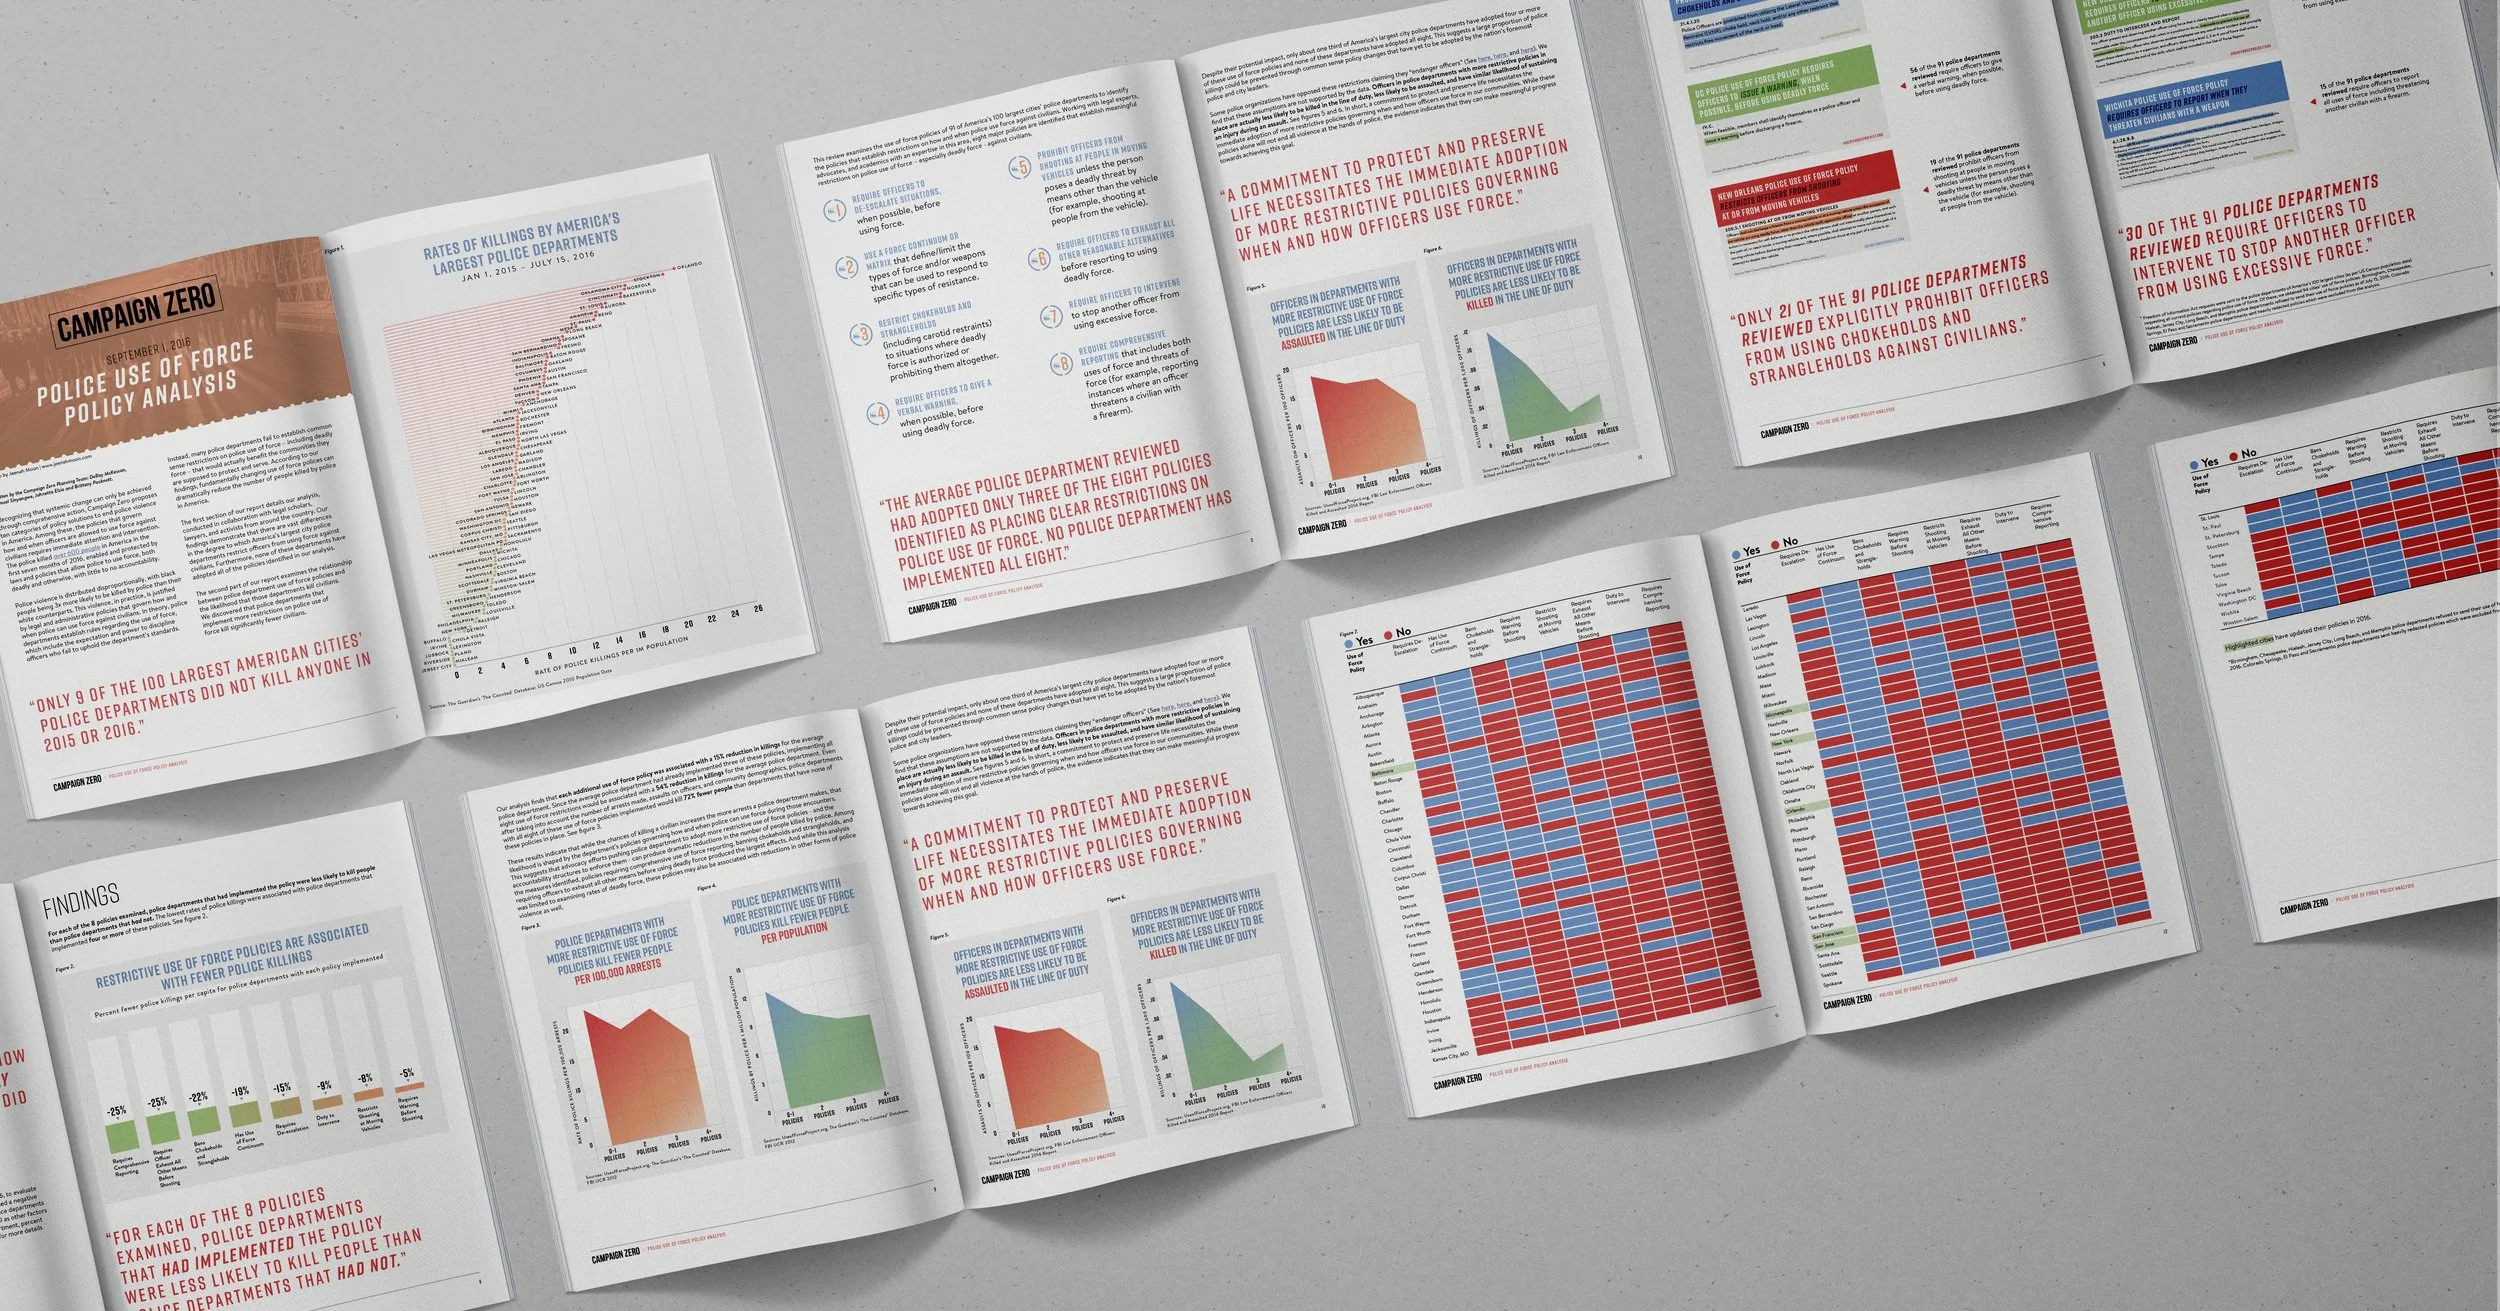
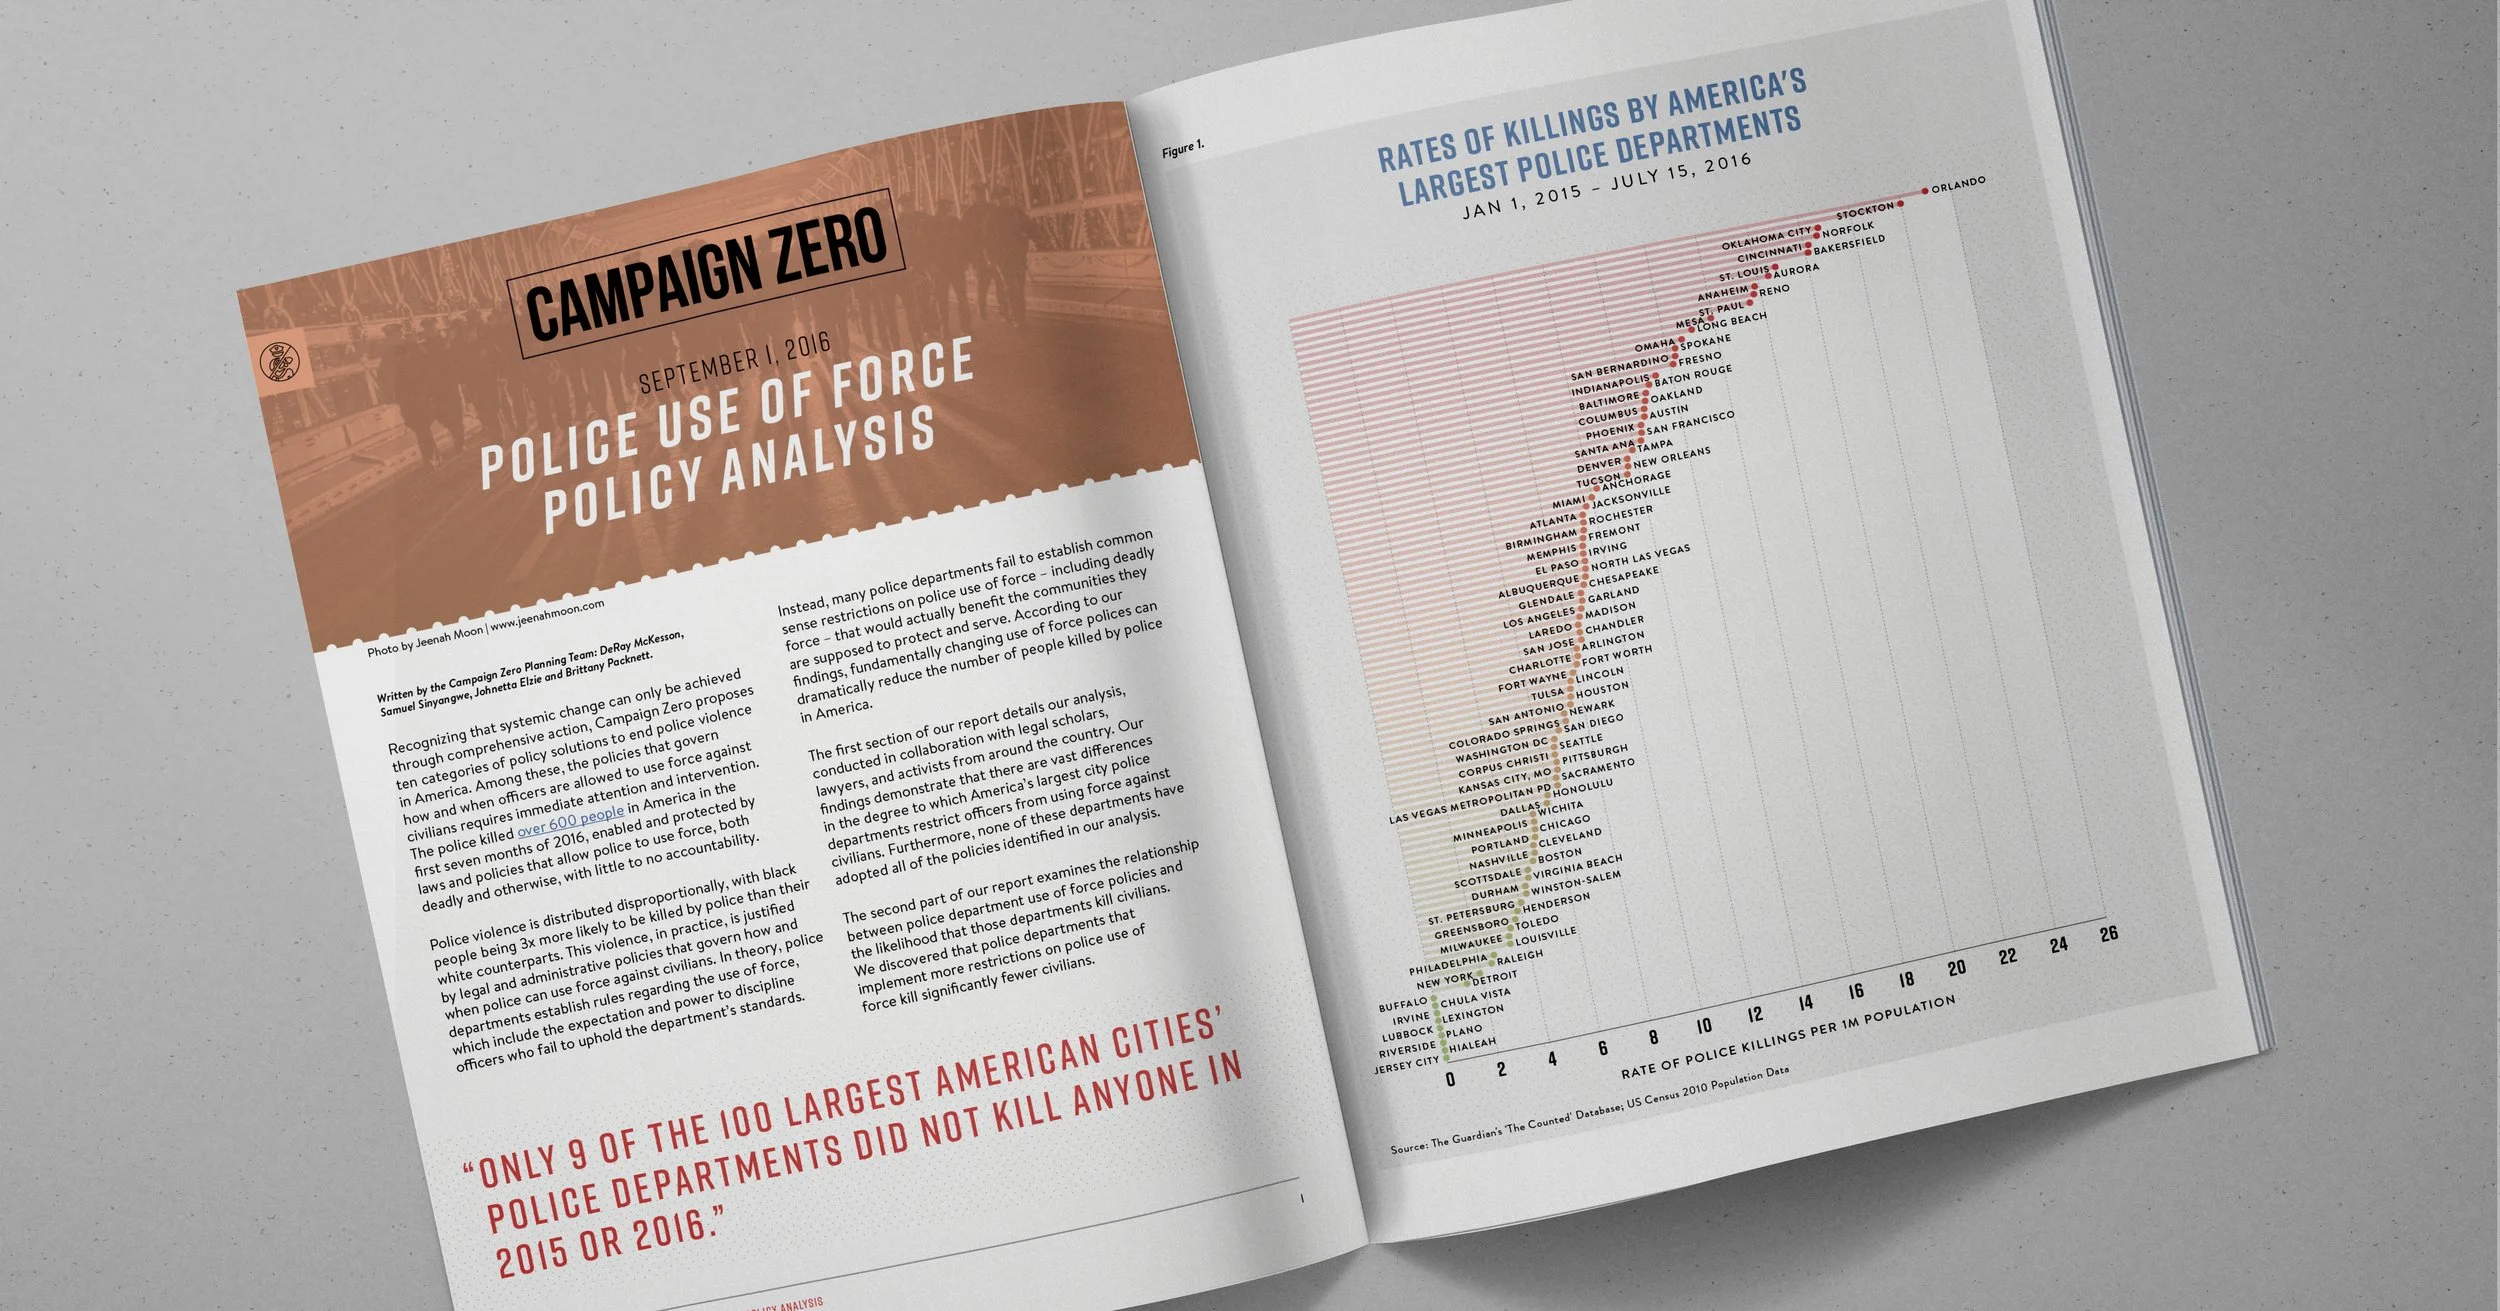
Campaign Zero’s Use of Force Policy Analysis translated policy research into a public-facing report examining how use-of-force guidelines correlated with police violence outcomes across major U.S. police departments.
The objective was to turn a dense dataset and policy framework into an accessible publication that could support public education, media coverage, and advocacy efforts while remaining rooted in evidence and clarity.
There is Power in Statistical Narratives
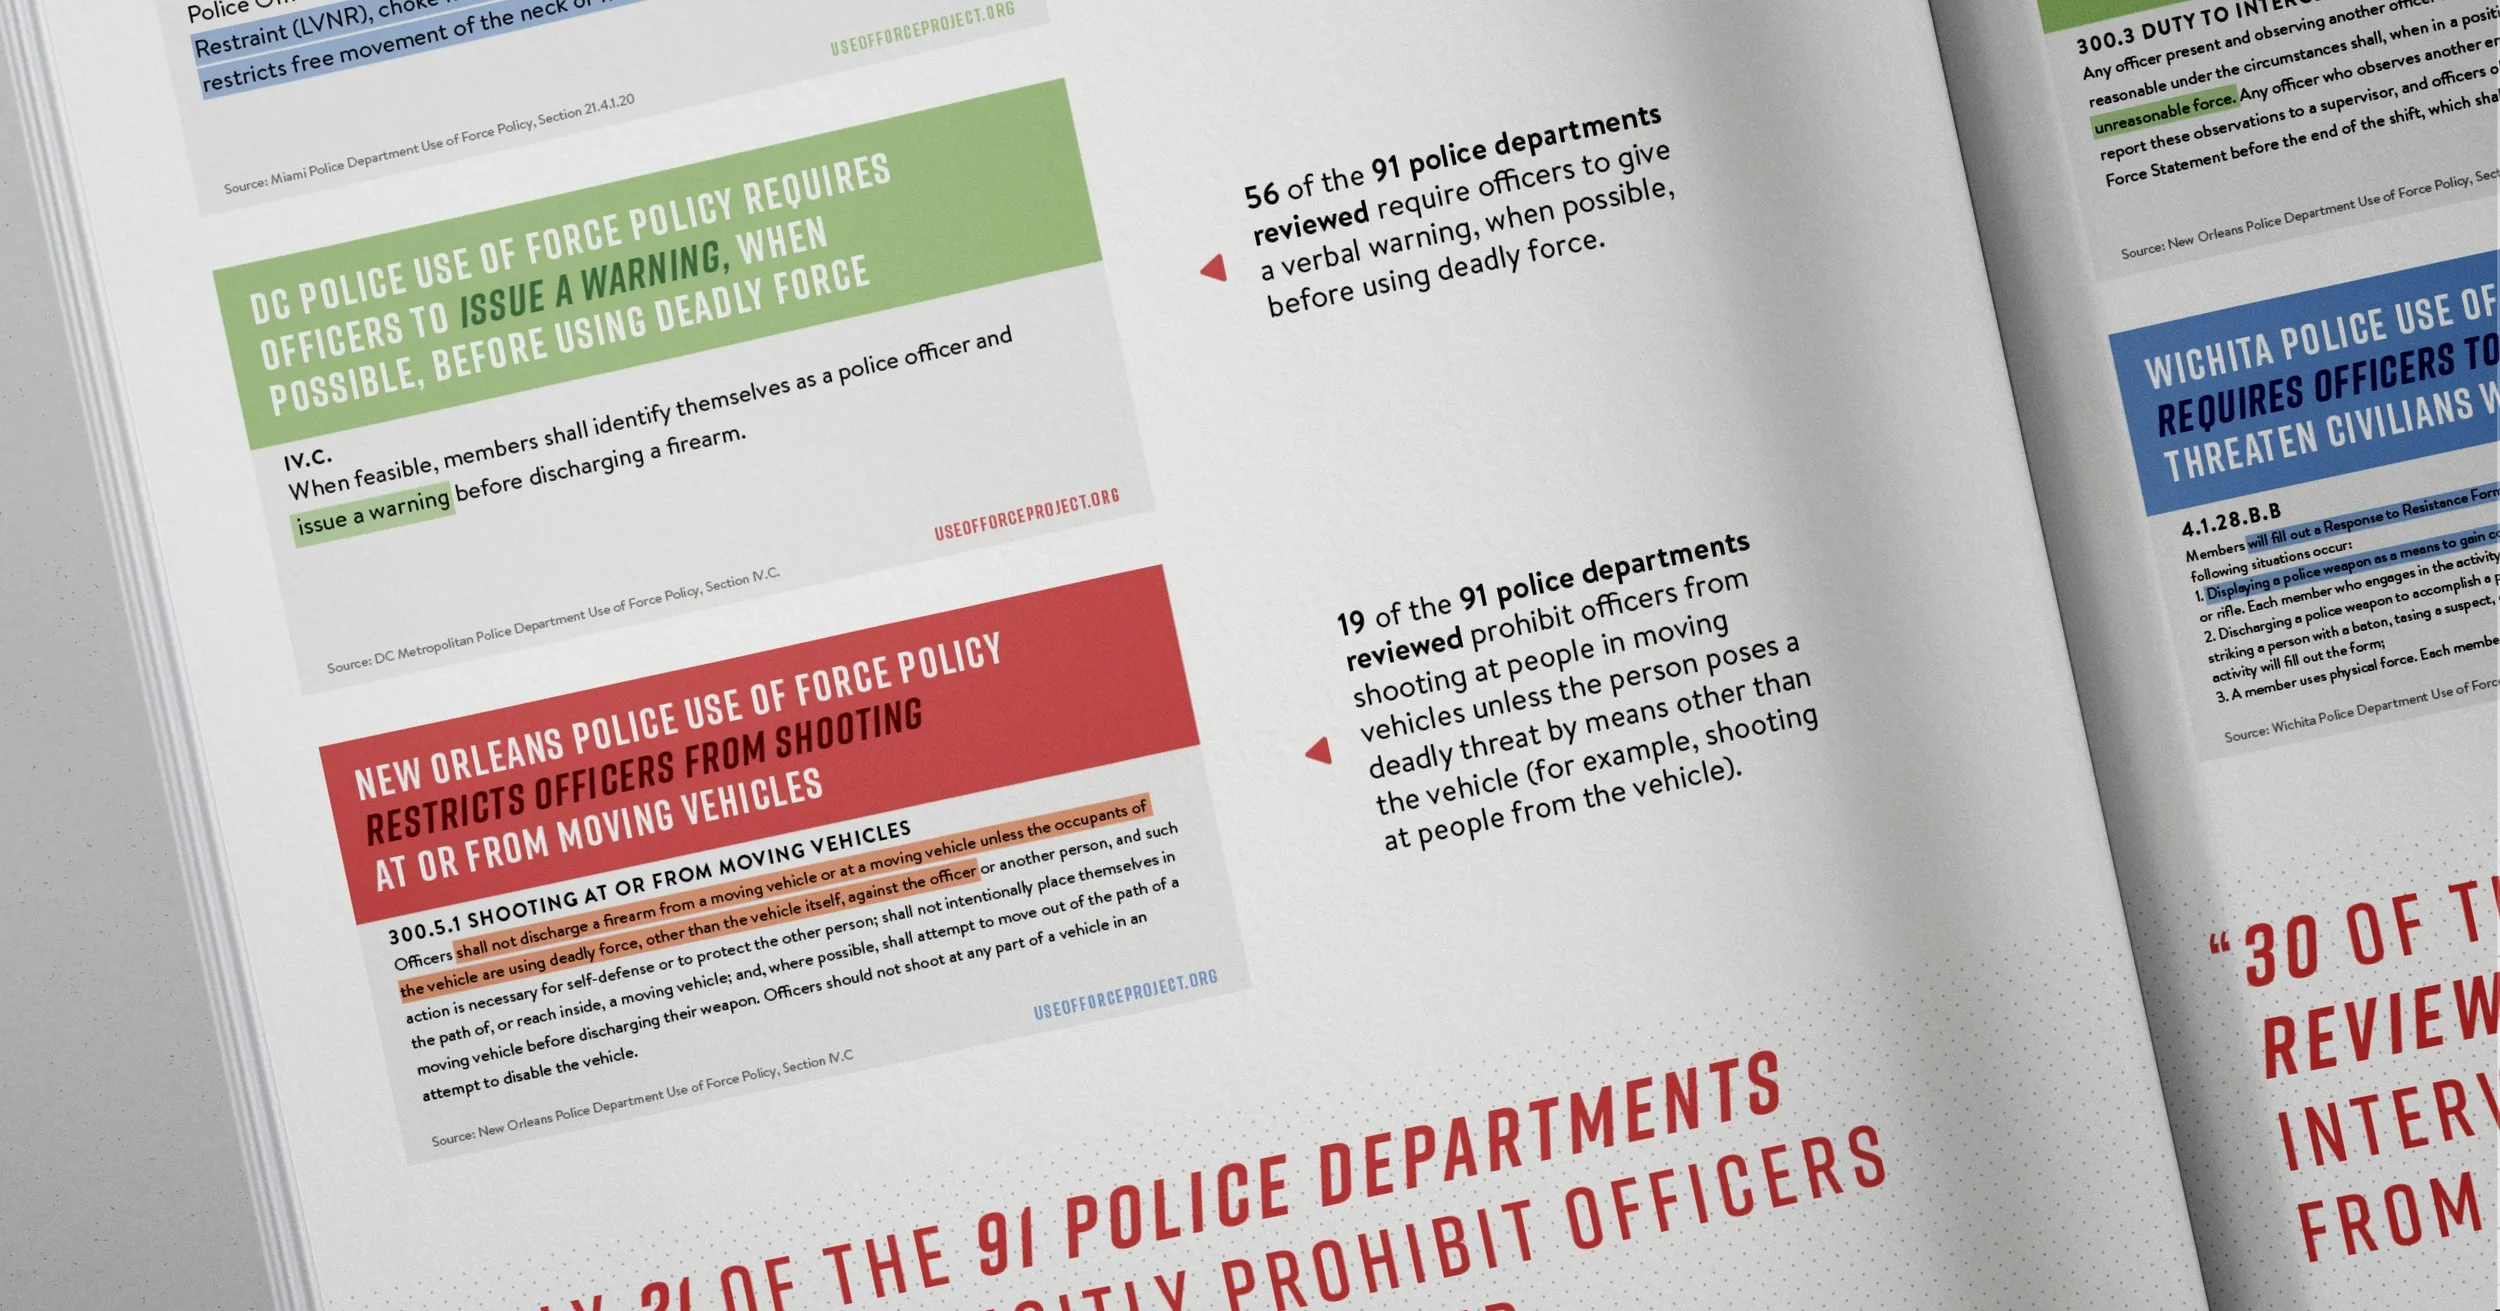
The report contained complex comparisons across departments, policy categories, and statistical findings. The design needed to help readers move quickly between analysis and action, making technical information understandable without reducing its credibility.
Because the report was intended to circulate widely online, the work also needed to perform beyond the publication itself across social platforms and campaign materials.
Retention and Comprehension
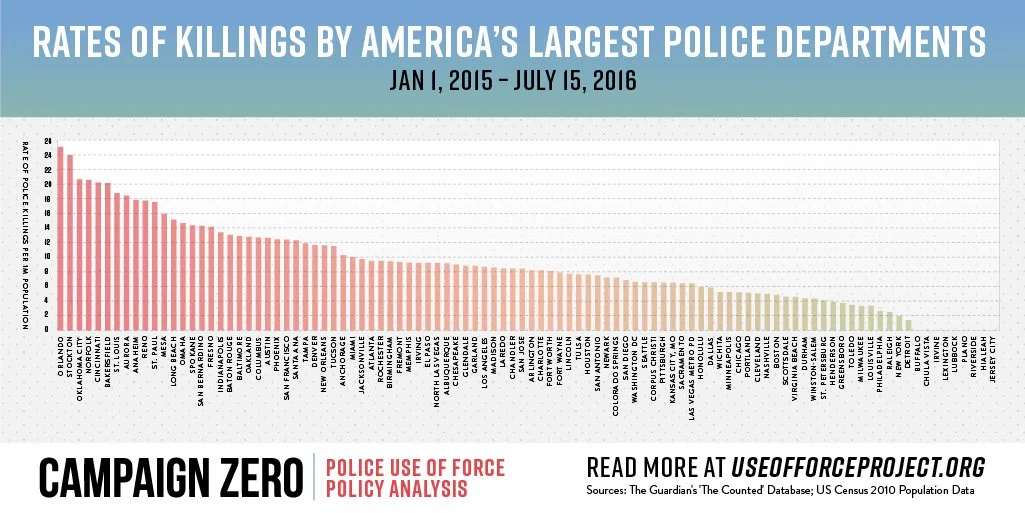
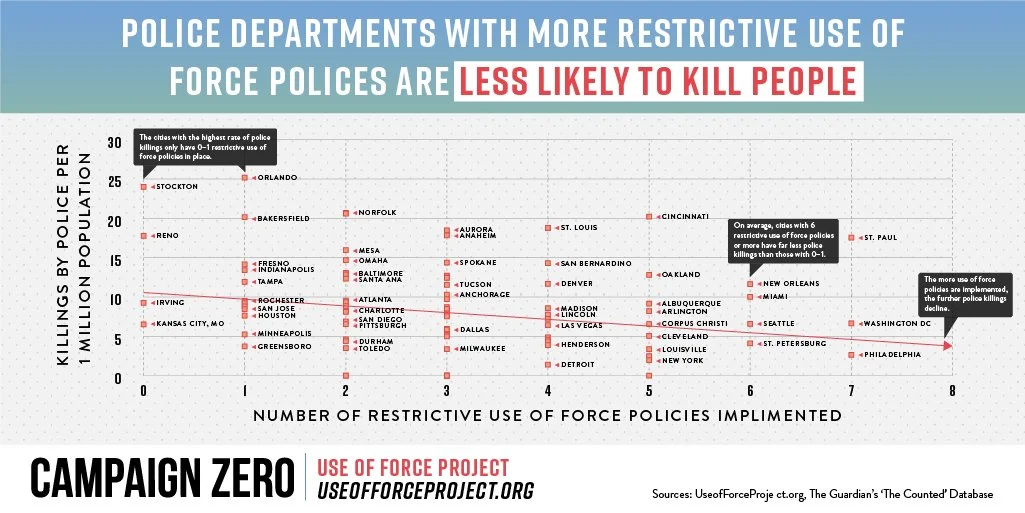
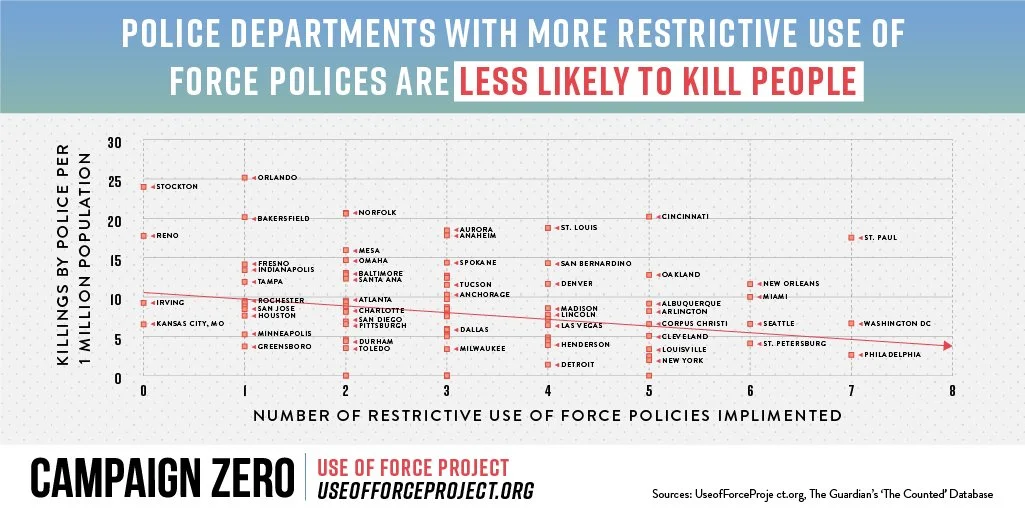
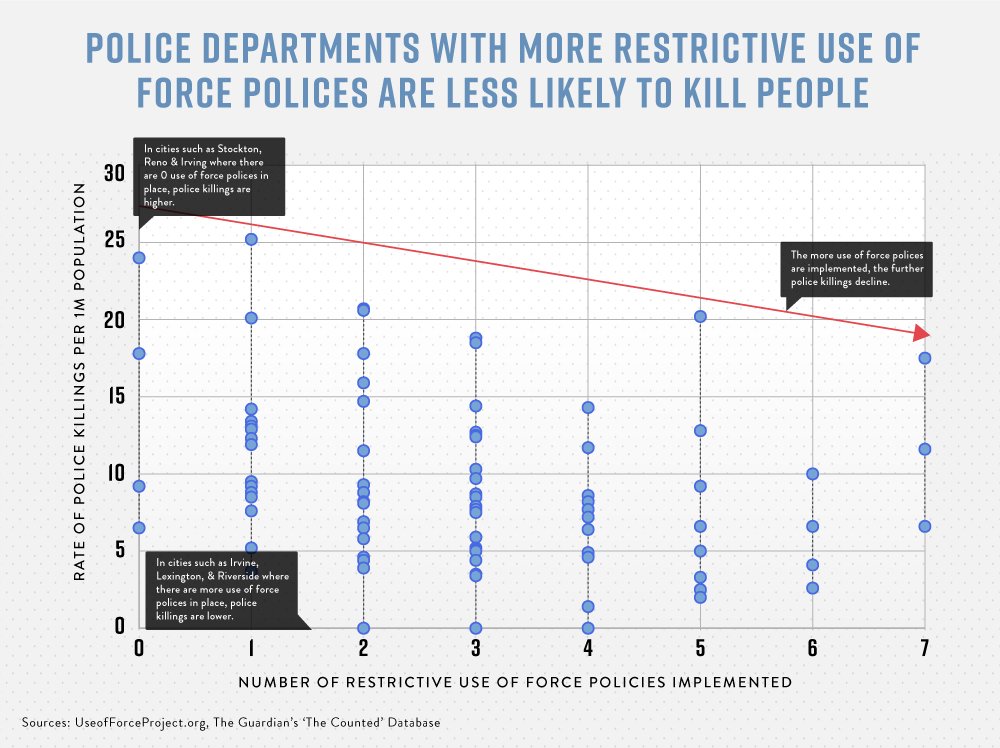
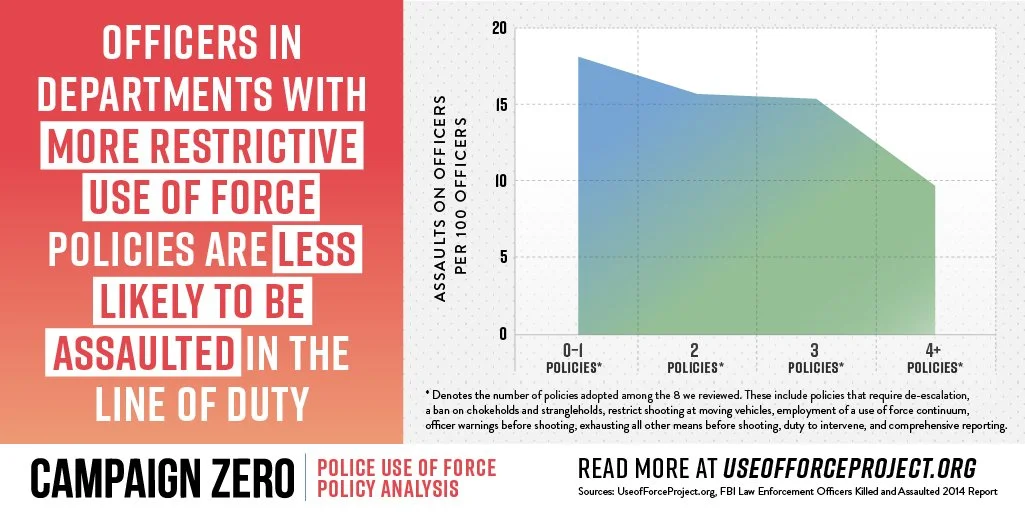
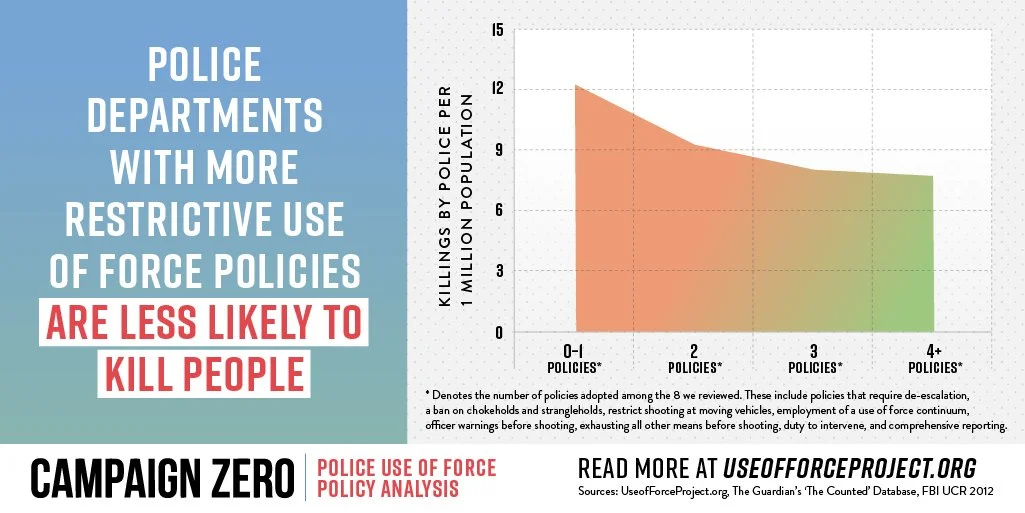
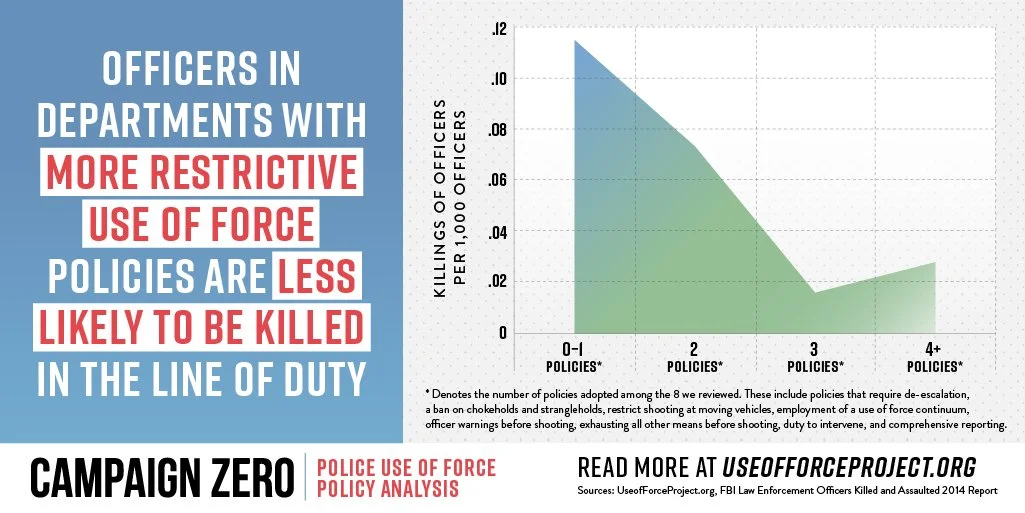
We developed an editorial system centered on readability, hierarchy, and rapid comprehension. Large-scale data visualizations, comparison matrices, and highlighted findings created clear entry points into the research while maintaining consistency across long-form content.
Visual emphasis was placed on making patterns visible at a glance through simplified color systems, modular layouts, and strategic pull quotes that surfaced the report’s strongest conclusions.

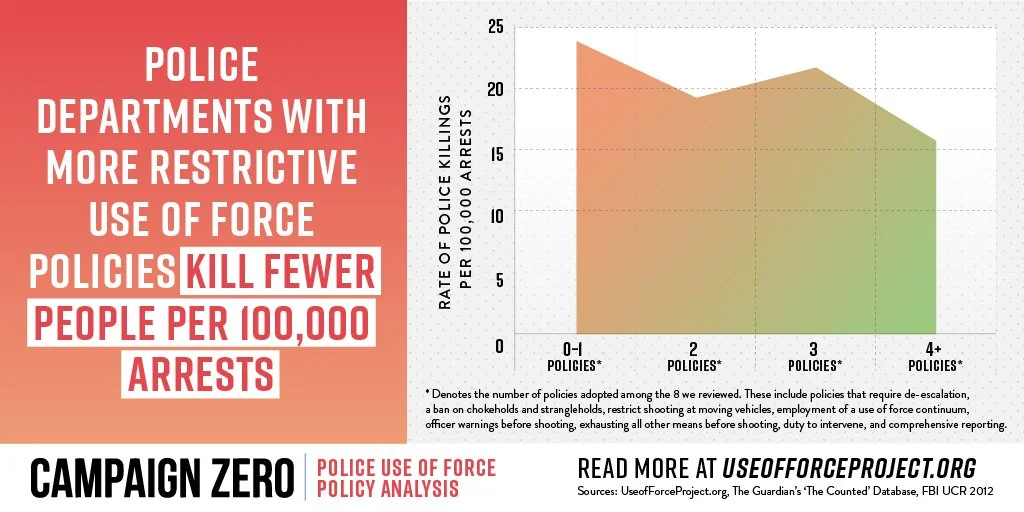
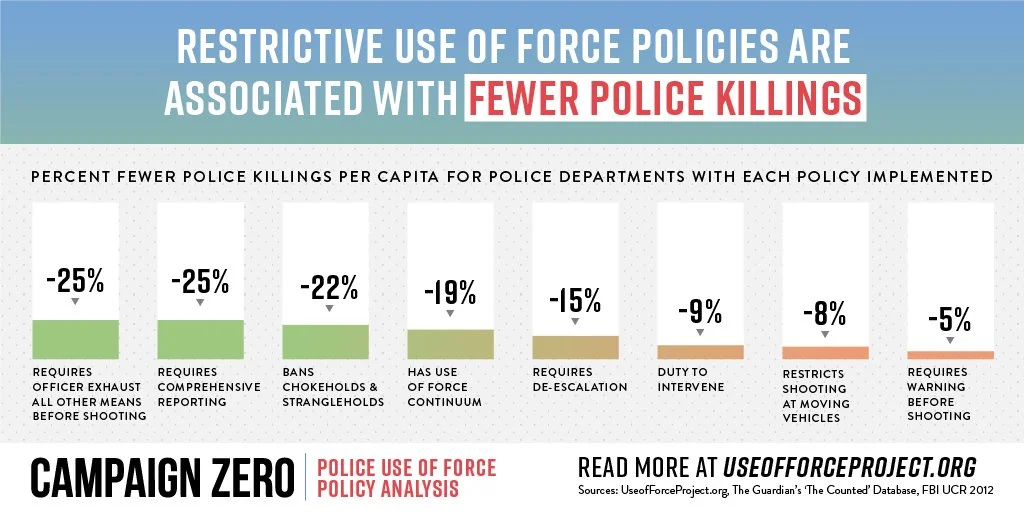
“Someone get this man his Twitter.”
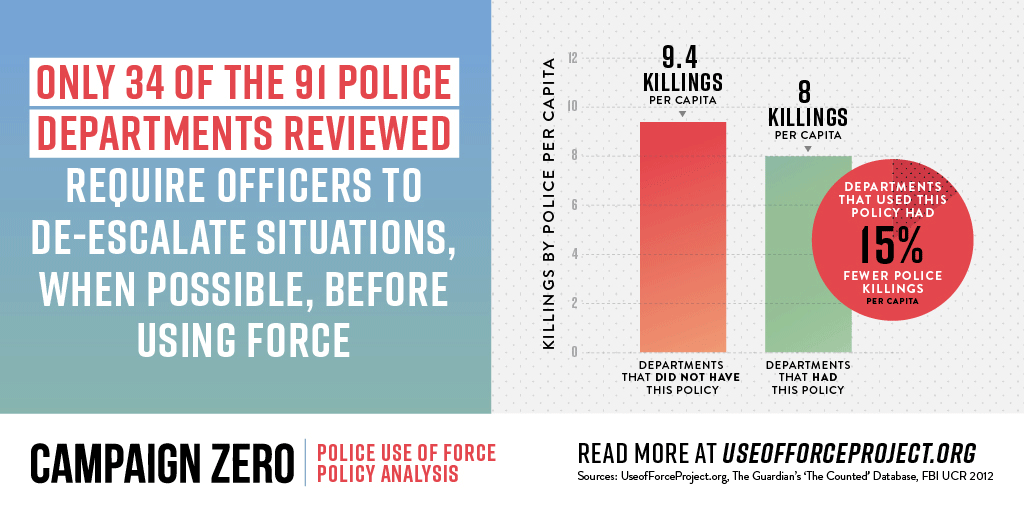
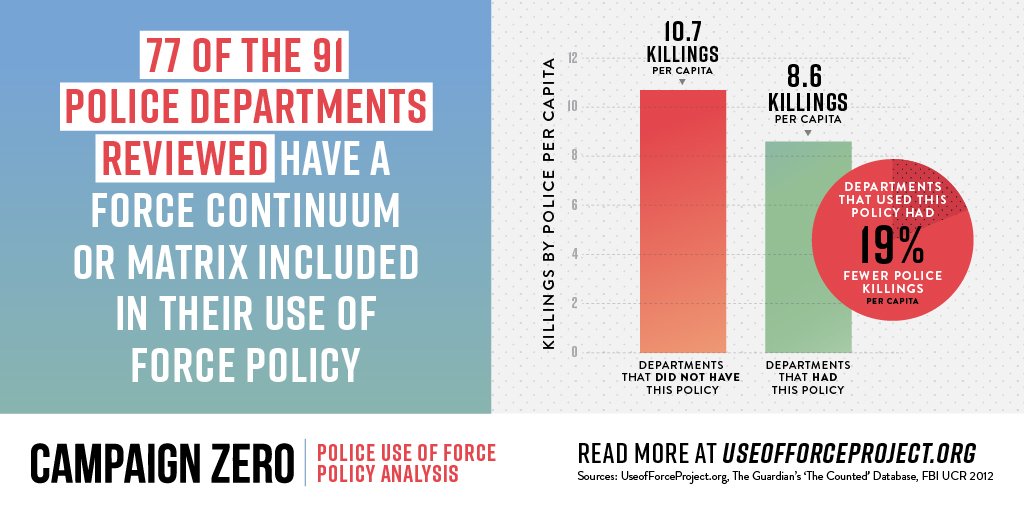
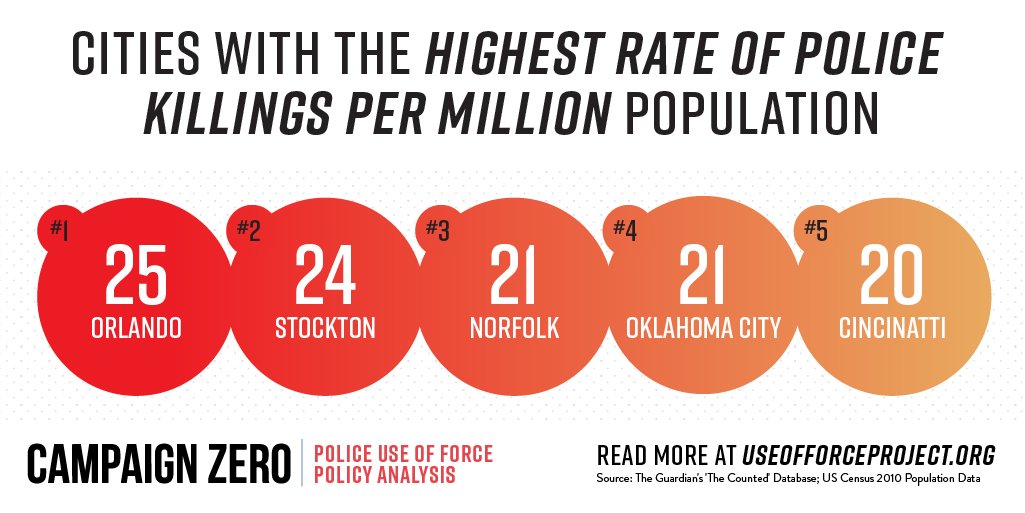
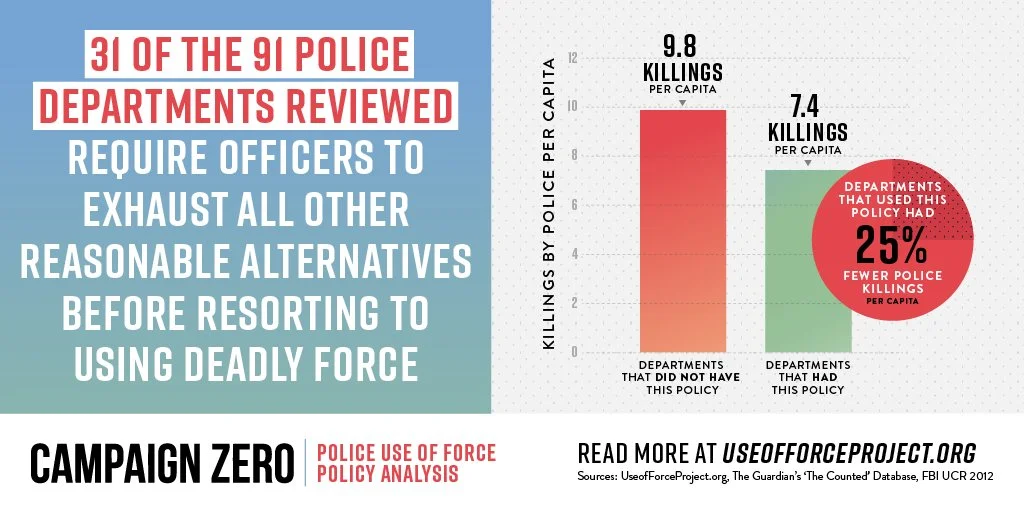
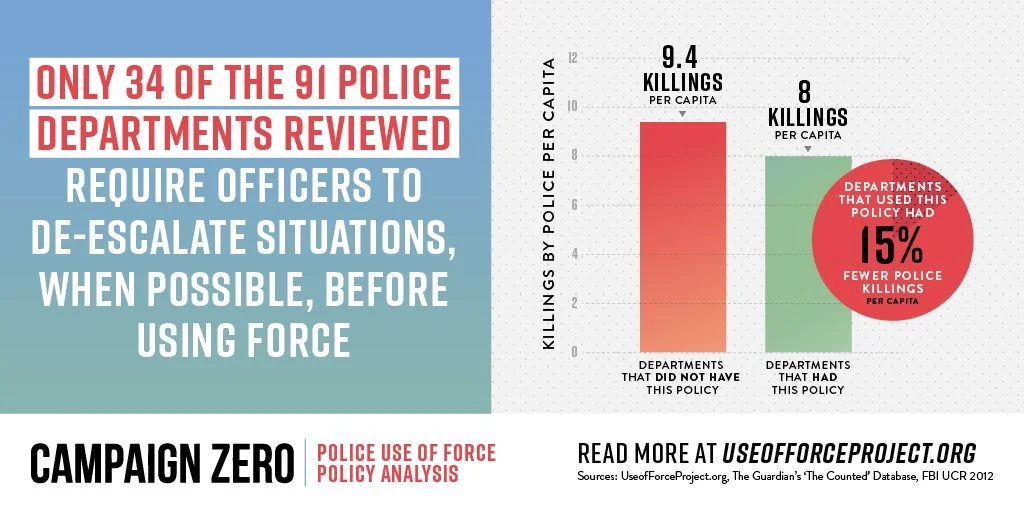
Alongside the publication, I created a suite of social graphics designed to extend the report’s reach beyond the PDF format.
Key statistics, charts, and findings were adapted into standalone visual assets optimized for sharing across social platforms. At the time, Twitter played a major role in organizing public conversations and accelerating activist campaigns, making concise, visually driven content especially effective for increasing visibility and participation.
These graphics helped transform research into content that could move quickly through digital spaces while preserving the integrity of the underlying data.